#Tableau #datamodel in my Bridges to Prosperity #MakeoverMonday2020 #Week4 challenge
For this month I thought that I would try my hand at a selected MakeoverMonday challenge. For this one I picked Week 4, the data set is available here.
I actually did this using the Tableau 2020.2 Beta (I have early access!) and my viz utilised Tableau's new #DataModel
Do you ever have to blend data at varying levels of detail (LoD)? This is a frequent challenge faced by analysts working in the field: you might get a transactional sales analysis of each and every sale across the organisation, but you might get a year-end debtors analysis that aggregates to major customer accounts. Reconciling between the two can get very time consuming, and a lot of the typical analyst's time is spent (nay, wasted?) in detailed reconciling of different records and manually transforming data sets in Excel.
Tableau's latest release tries to do away with this by introducing the "Data Model" (also known by us affectionately in the community as the "Data Noodle"), and this functionality supersedes somewhat the old functionality of joins and blends.
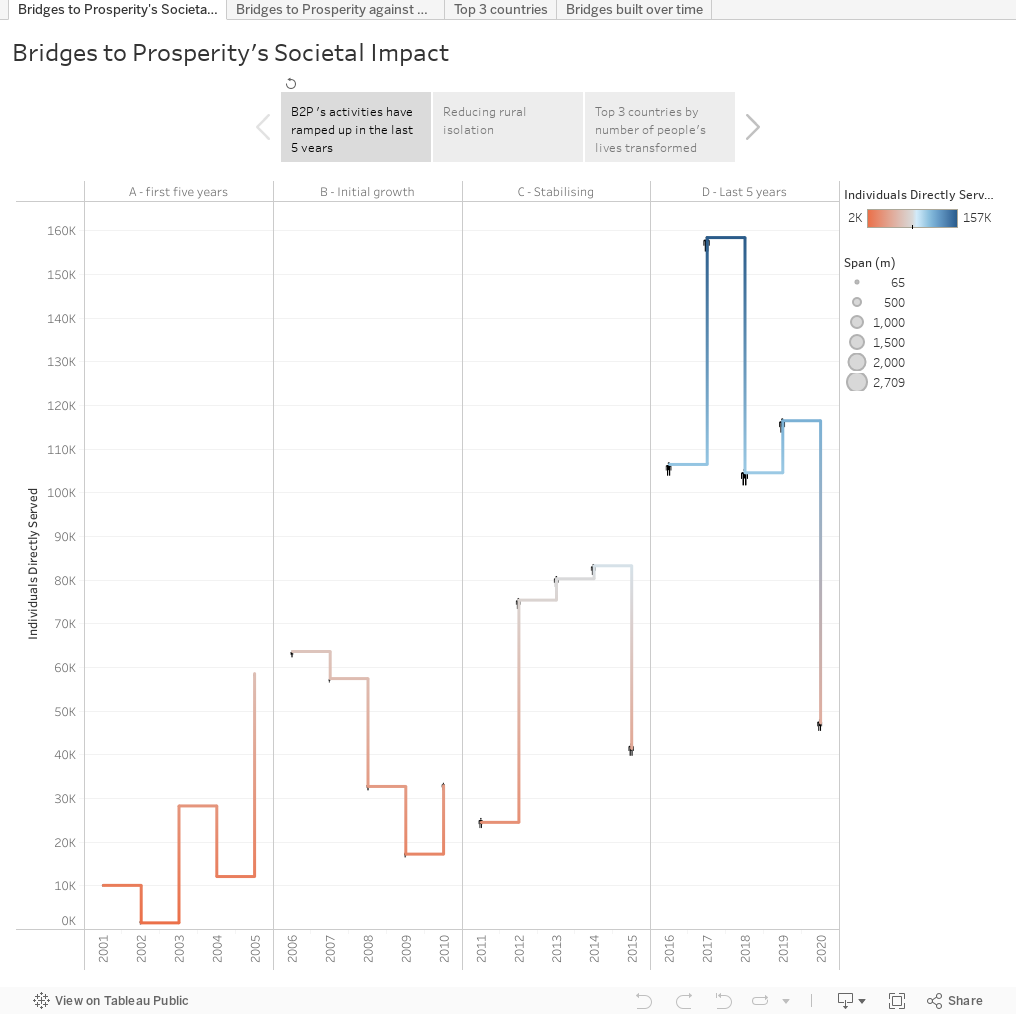
In this data set, I had one set of data aggregated to the country level (country populations and socio-demographics) and another data set at the detailed level of bridges (which rolled up into the country level). The Tableau Data Model made it very easy to define the relationship between the levels of detail and Tableau just "automagically" visualised the details, reconciling between the different LoD.
So after teaching myself a little bit about implementing the new Data Model, I downgraded the version that I uploaded to Tableau Public just so that I can demonstrate the use of Stories and Dashboards. Let me know what you think!
I actually did this using the Tableau 2020.2 Beta (I have early access!) and my viz utilised Tableau's new #DataModel
Do you ever have to blend data at varying levels of detail (LoD)? This is a frequent challenge faced by analysts working in the field: you might get a transactional sales analysis of each and every sale across the organisation, but you might get a year-end debtors analysis that aggregates to major customer accounts. Reconciling between the two can get very time consuming, and a lot of the typical analyst's time is spent (nay, wasted?) in detailed reconciling of different records and manually transforming data sets in Excel.
Tableau's latest release tries to do away with this by introducing the "Data Model" (also known by us affectionately in the community as the "Data Noodle"), and this functionality supersedes somewhat the old functionality of joins and blends.
In this data set, I had one set of data aggregated to the country level (country populations and socio-demographics) and another data set at the detailed level of bridges (which rolled up into the country level). The Tableau Data Model made it very easy to define the relationship between the levels of detail and Tableau just "automagically" visualised the details, reconciling between the different LoD.
So after teaching myself a little bit about implementing the new Data Model, I downgraded the version that I uploaded to Tableau Public just so that I can demonstrate the use of Stories and Dashboards. Let me know what you think!


Comments
Post a Comment