Can you do this analysis in Tableau?
If all you know how to use is a hammer, everything looks like a nail!
I frequently get asked, "Izam, can you use Tableau to create a chart that looks like this ..." or "Izam, can you use Tableau to calculate this ..."
Lately, I've been thinking about how the tools we use shape the way that we go about solving problems. And the above adage comes to mind: if all you know how to use is a hammer, everything looks like a nail!
Excel and PowerPoint are great for writing documents and reports. Reports which go about answering the: "WHAT" are we planning to do? "HOW MUCH" are profits? or "WHEN" does it need to be done by?
Tableau on the other hand, shines when we use it to explore the question ... "WHY" is this trend happening?
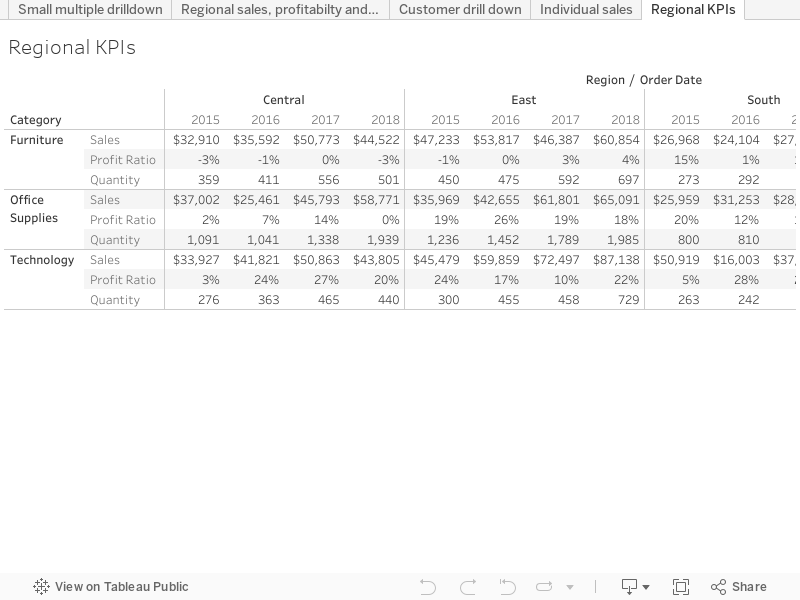
"How much are profits?"
For example, with the Superstore sample data set, an analyst might be interested in building out a table that compares the key performance indicators of the different regions
In the context of the finance world - we'd be interested to know "how much are profits" because we may need to develop a forecast of the business, and we need to understand what has driven profitability.
Why don't you try follow along with me? Open up a new tab and view the crosstab here. What sort of questions might you ask?
Had a stab at that? Good!
And so, an analyst just like you would arrange an interview and go through the table of KPIs with management ... asking about the trends reported in this crosstab.
Tableaufit calls this, a focus on "What is the Number?". A focus on quantifying the result. This is important in the finance world when you view it in a competitive, zero-sum game lens, it becomes paramount to understand what is the number because that number could drive my gain, at your expense. Or vice versa, your gain at my expense.
But Tableau lets us do more than just "what is the number" and gives us the analytical tools to dig down in to "why is the number".
But Tableau lets us do more than just "what is the number" and gives us the analytical tools to dig down in to "why is the number".
 |
| Quora |
"Why is this trend happening?"
 |
| Regional KPIs as a viz |
Rather than "What is the number?" ... a more interesting question to ask is ... "Why is this trend happening?" and ... "How can we shape our strategy to capitalise on this trend?"
Rather than purely reporting on "What is the number?", the focus can start to move towards, "What can we do to make this business run better?". I view the world with a win-win lens. There is room for both you and I to grow the pie together and to mutually benefit. In order for us to both mutually gain, we need to seek these sources of value and strategise how we can leverage our resources to create that value for all of us stakeholders.
So in this case, we can see from a glance that there is a problem in the profitability of office supplies in the most recent period of Central. Would you get the same message with the crosstab? Actually, we could go one step further and build a dashboard that helps us pivot across the data and drill down in to one level of "why is this loss making?"

Now, with the ability to drill down in to the most granular level of detail: per customer order, we can see that not only is there a problem with office supplies in Central ... but it's being dragged down by an outlier customer: "Henry Goldwyn". We can further drill down by segment and we can see that profitability is being dragged down by the "Appliances" segment.
The analyst might now be developing a new hypothesis: "Maybe we're seeing the impact of loss-leader products: products being sold at deep discounts in order to attract customers to buying other products". This might then lead the analyst to focusing more on sales strategies.
I suggest to you that using Tableau and using a drill-down, iterative approach to Visual Analytics, the analyst is getting to these insights quicker and in a more robust, repeatable way than with the crosstab approach above.
What do you reckon?
p.s. the dashboard needs more work to conform to Visual Analytics best practice ... but more on that for my next blog post.
The bottom line
So the answer to the original question ... "Can you do this analysis in Tableau?" ... isn't really asking the right question. What we want to be asking is less "Can you reproduce this report in Tableau and recalculate The Number".We want to know ... "What are the factors that have driven this number, and what is the opportunity in there for us?"
If I was appraising an acquisition of this superstore business, I might want to understand the potential synergies and risks in melding two sales organisations together, and having these dashboards at hand can really help drive that strategy development. I might want to adjust my post-merger integration plans to converge the acquirer's and the target's sales strategies by changing sales incentives for my sales staff.


Comments
Post a Comment